
Built on Trusted Sources, Processed for Immediate Use.
Historical: 1901–2024 · Future: 2025–2100
Continuous climate records from observational data combined with projections across 3 SSP pathways (SSP2.6, SSP4.5, SSP8.5).
Sub-District · District · State
Available at block and district level across India. No aggregation or spatial processing required on your end.
13 Hazard Types · 3 Compound Events
Covers single hazards (heatwave, coldwave, drought, flood) and compound events (drought followed by flood).
Centennial Climate Projections
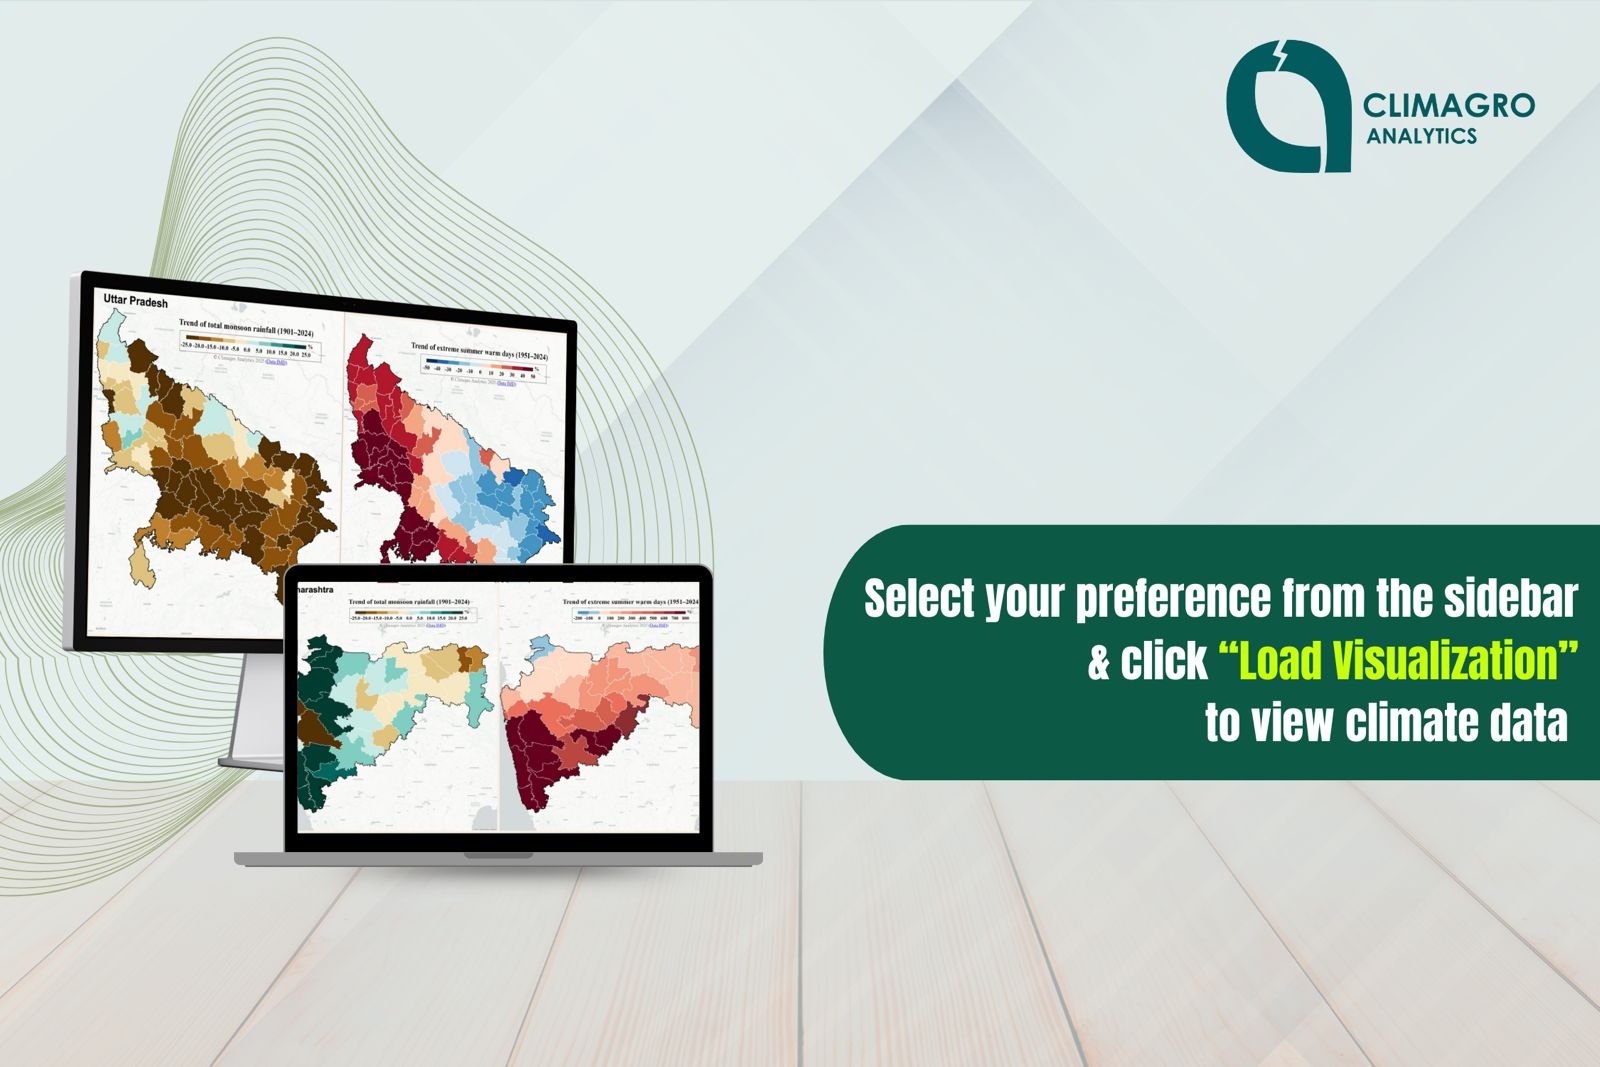
Interactive mapping of historical baselines with high-resolution SSP scenarios built into our forecasting model.
Granular Administrative Mapping
Drill down dynamically from states to district and sub-district level boundaries with zero manual GIS processing.
Compound Climate Threats
Monitor multiple physical hazards and multi-hazard compound threats (e.g. wet spells, extreme warmth, droughts) simultaneously.
From Raw Climate Records to Analysis-Ready Intelligence
Four steps — entirely handled by ClimIntellio. Nothing for you to process, clean, or reformat.
Multi-Source Ingestion
Climate records from national observational networks, global reanalysis products, and satellite-based precipitation estimates are ingested and harmonised into a single consistent dataset — resolving gaps, inconsistencies, and format differences across sources.
Scientific Processing
Automated pipelines compute 30+ impact-relevant climate and hazard metrics at block, district, and state level — across historical (1901–2024) and future (2025–2100) time horizons.
Hazard Intelligence Generation
Hazard scores and trend indicators are generated for 13 hazard types — including compound events — calibrated to administrative boundaries, not just grid cells.
Delivery to Your Workflow
Receive analysis-ready data via Web Portal, CSV download, or API integration — formatted for direct use in your models, reports, or dashboards.