The climate datasets are available in various temporal scales: paleo, historical (since the start of the last century), present, and future (till the end of the current century). These datasets are available in multiple spatial resolutions, varying from hundreds of kilometers to a few kilometers and even meters. Users can choose the datasets per the required spatial and temporal resolutions, depending on their needs, as most of these datasets are freely available to download. Later in this document, you will find some widely used climate data sources. Parallelly, these datasets are available based on station-points, gridded, model-based, and reanalysis.
Furthermore, historical climate information forms the basis for predicting the future climate. The past observed data is used to develop, calibrate, and validate numerical models that can replicate the history (hindcast) and present, and consequently predict the future. Inclusively, the information also helps analyze multiple scenarios, such as how different possible levels of greenhouse gas emissions can affect the climate, how different socioeconomic conditions can impact the climate, how changes in land use can reflect on the regional climate change, and so on. These scenario-based propositions can help policymakers understand the potential impacts and prepare various measures accordingly.
Here is a brief description of different types of climate datasets, along with a few (but not limited to) widely used data sources that are freely available with a direct download option or registration that is free of cost.
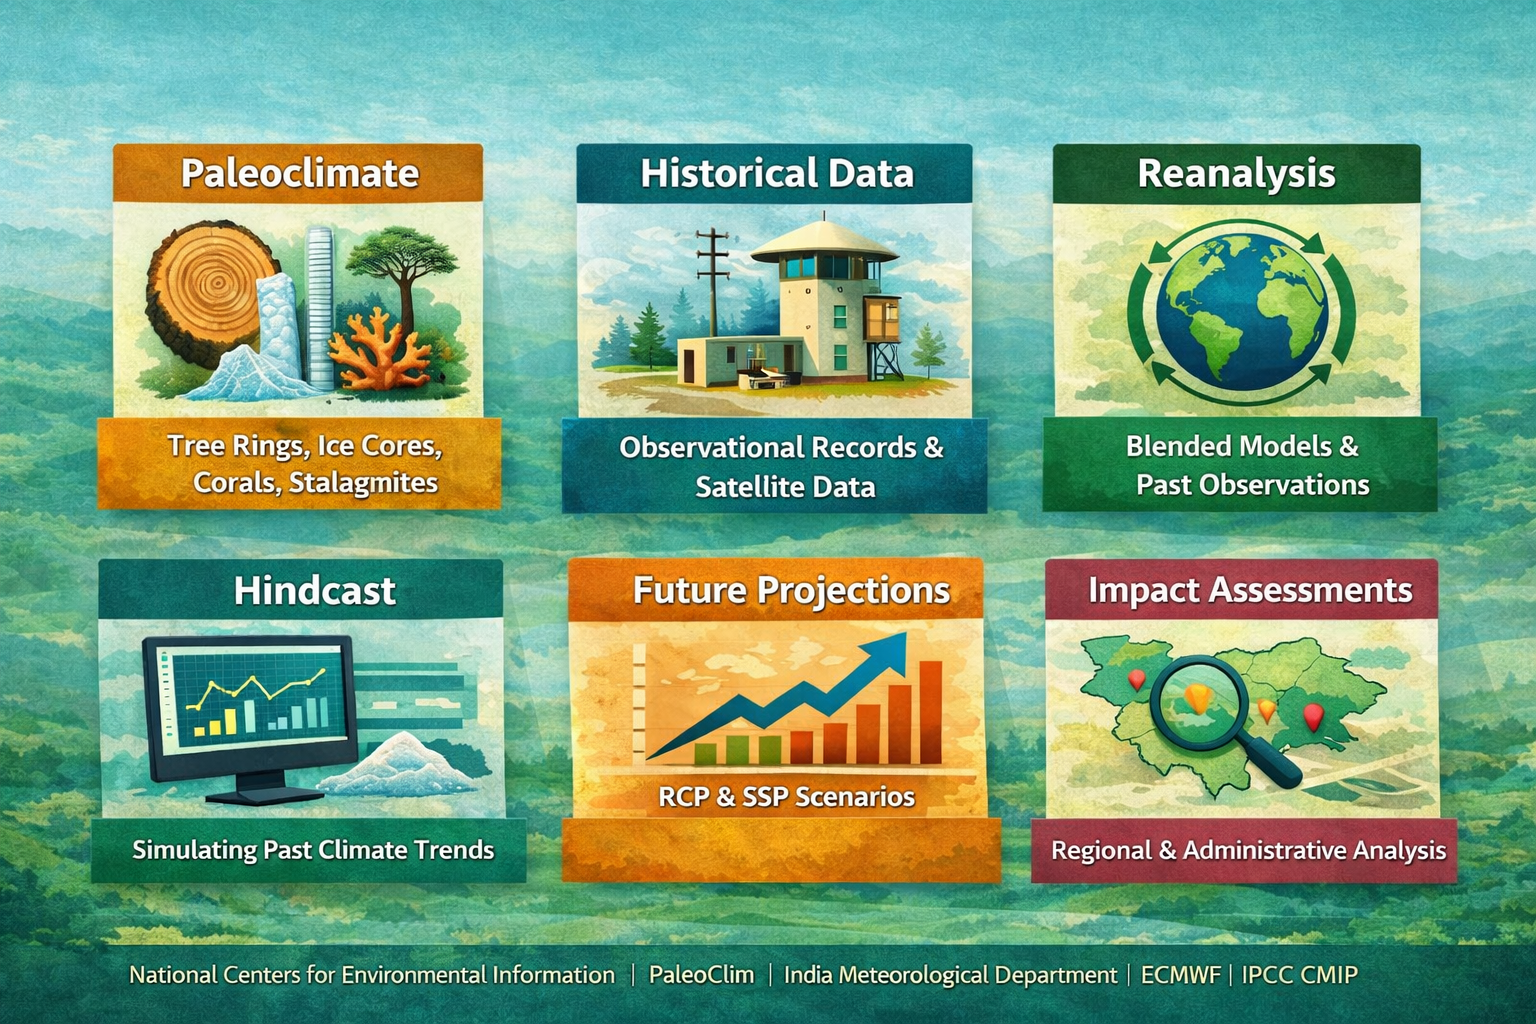
Paleoclimate
These datasets represent the proxy of Earth’s climate dating back from hundreds to millions of years, derived through natural archives such as:
- Tree ring based: Derived by inserting tree-core drills into living trees and extracting their cores, thereby analyzing the width, cell density, and other characteristics. This information assists scientists in understanding the past temperatures, precipitation, forest fires, and any other extraordinary conditions the tree faced in its lifetime.
- Ice cores: Derived by inserting drills into glaciers or ice sheets in the polar regions and higher altitudes, to extract ice cores. Since these cores contain layers of compressed snow that have trapped air bubbles for years, scientists can analyze their water isotopes to understand the changes in atmospheric composition and regional temperature profiles.
- Corals: Similar drills are inserted in ocean and sea corals to extract the cores, which scientists can analyze to examine the ocean temperatures over time.
- Stalagmites: Stalagmites grow over time as water drips down from a cave’s ceiling or pools on its floor. It results in the buildup of mineral deposits, which can assist in understanding the climate patterns in the past, including any heavy precipitation or drought events faced in the region. Similar analyses are done for rocks to recognize the distinctive pattern of sediments deposited by glaciers or mountains.
Once these natural archives are extracted, scientists use the information to reconstruct the climate story for that location. Below are a few data sources that provide paleoclimatic information for region-specific studies:
- National Centers for Environmental Information: Spatial resolution: ~1–4 km at the equator; temporal resolution: biweekly to millennial.
- PaleoClim: Spatial resolution: ~5 km at the equator; temporal resolution: monthly.
Historical datasets
These datasets span a comparatively shorter time period than the paleoclimate data. Typically, these datasets can be procured from the start of the last century (i.e., 1901) till the recent years or months. Different types of historical datasets, along with the commonly used data sources, are discussed below.
- Observed: Derived based on the ground observations through weather stations, gauges, laboratories, or airborne observations. These observations are often interpolated to derive uniform information across space and time. Commonly used data sources for India case studies include:
- Satellite-derived: These datasets are derived from the signals received by satellites and support long-term to real-time monitoring of Earth observations. Commonly used sources include:
- Reanalysis: These datasets are derived by assimilating past climate observations with models or satellite data to generate consistent time series. Commonly used sources include:
- Hindcast: These datasets simulate historical climate using past observations to validate numerical models. Common data sources include:
Future projections
- Forecasts and sub-seasonal to seasonal predictions:
- Radiative forcing–based projections:
- Socioeconomic pathway–based projections:
Impact assessments for administrative boundaries
Climate datasets are generally available at station-based or gridded levels. However, these datasets need to be spatially aggregated or disaggregated to assess impacts at administrative boundaries such as states, districts, rural or urban blocks. This administrative-level information is critical for localized climate impact analysis and policy planning. To support such applications, we provide district and sub-district level climate indicators such as averages, trends, and anomalies. Please have a look at our data portal website.
Hope you enjoyed reading this document and gained basic information on climate, the importance of climate datasets, and their types. Again, feel free to contact us if you need more information or want to procure any data from the raw data sources or our own climate data portal.